
In this area of North Florida corn planters are usually rolling by the first week of March. I suspect there may be one or two going already. However, February weather has been a bit unnerving for most as they are ready to get the cropping season underway. I was a bit surprised when I looked at the rainfall for February, there were only 10 days of measurable rain in the month of February and about 3″ to 4.5″ depending on the location in this area. I’m fairly certain that of the other 18 days, not many were suitable for field work, especially where soils may be a little heavier.
Forecasts still don’t look promising, but farmers are using each available opportunity to apply burndown herbicides before planting corn. I recently took part in a farm tour hosted by University of Georgia Extension to several farms in Dooly County, GA. This tour, aligned with the Conservation Tillage Production Training Conference, was a good opportunity to see innovative practices in South Georgia.
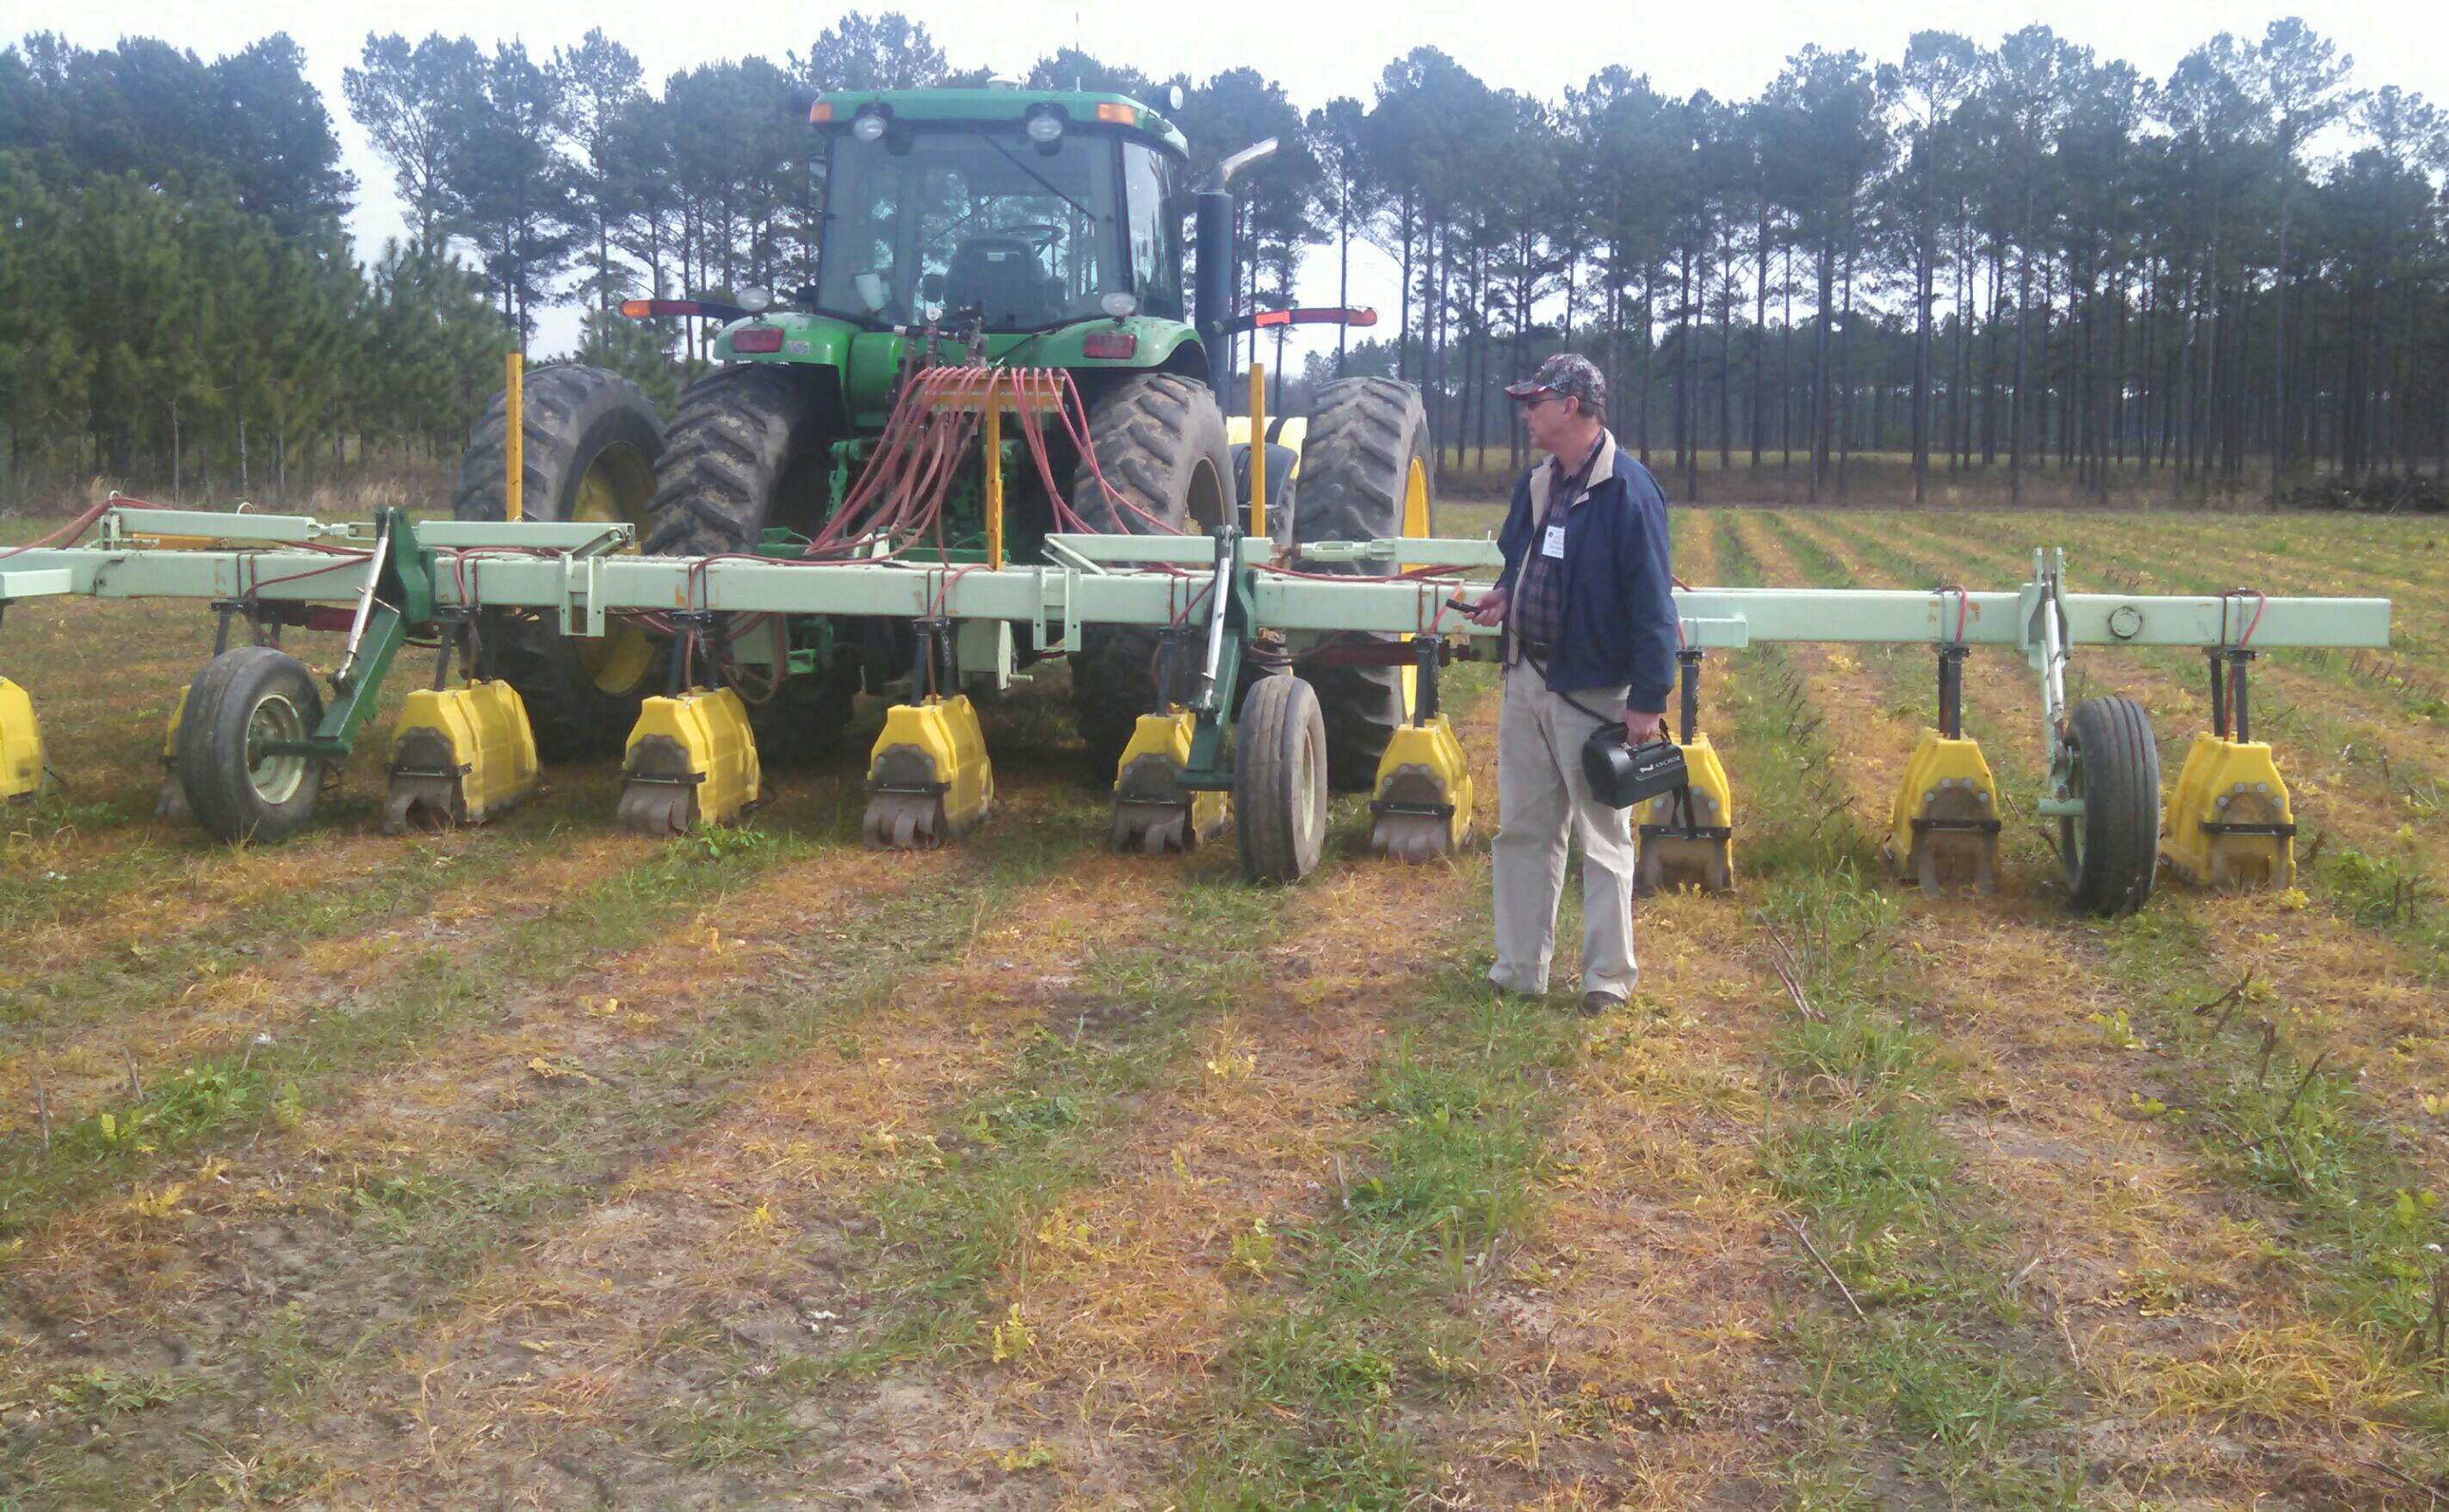
Mr. Ronnie Barentin of UGA Extension in Dooly County GA describes equipment for banding herbicide. The herbicide strip was sprayed weeks prior for demonstration.
One farmer’s precision banded sprayer for application of burndown herbicide was particularly interesting. The farmer indicated in past years, when dry weather struck before terminating cover crops, he would often lose soil moisture in the planting strip and have poor emergence or be forced to plant beyond his target date following additional rainfall. Therefore, he devised a system to terminate cover crops in the (future) planting strip using GPS Auto-steer technology. In this system th cover crop in row middles is allowed to grow several more weeks to gain the benefits of higher biomass. If conditions warrant, the farmer can still jump out and terminate the row middles, but this gives an opportunity to increase the biomass of cover crops for weed suppression and soil mulching with less risk. In South Georgia and North Florida soil moisture management in the Spring is often the difference in success and failure in rain-fed farming systems.
mace,
here are the average, min and max soil temps at 4 inches form area IFAS weather stations(FAWN). some counties are teetering on recommended corn planting soil temps of minimum 55 degrees and some are not quite there. Joel
University of Florida, Florida Automated Weather Network
Archived Weather Data »
Report
All observation times are local standard time for each station (without daylight saving time).
Alachua (Status: Active)
Period
Tsoilavg
−10cm (F)
Tsoilmin(avg)
−10cm (F)
Tsoilmax(avg)
−10cm (F)
N
(# obs)
22 Feb 2015 57.08 54.63 60.19 96
23 Feb 2015 59.84 58.19 61.86 96
24 Feb 2015 60.50 59.92 61.45 96
25 Feb 2015 59.37 58.42 60.22 96
26 Feb 2015 60.56 59.58 61.16 96
27 Feb 2015 58.43 57.20 59.54 96
28 Feb 2015 57.47 56.79 58.14 96
1 Mar 2015 58.74 56.57 61.70 96
2 Mar 2015 61.81 60.57 66.02 71
Bronson (Status: Active)
Period
Tsoilavg
−10cm (F)
Tsoilmin(avg)
−10cm (F)
Tsoilmax(avg)
−10cm (F)
N
(# obs)
22 Feb 2015 60.61 55.18 66.74 96
23 Feb 2015 64.61 60.73 70.03 96
24 Feb 2015 64.75 63.01 66.58 96
25 Feb 2015 63.49 60.58 66.92 96
26 Feb 2015 64.30 61.54 66.02 96
27 Feb 2015 61.46 57.85 65.57 96
28 Feb 2015 60.76 59.47 62.74 96
1 Mar 2015 63.19 58.30 69.33 96
2 Mar 2015 67.26 64.24 74.43 71
Live Oak (Status: Active)
Period
Tsoilavg
−10cm (F)
Tsoilmin(avg)
−10cm (F)
Tsoilmax(avg)
−10cm (F)
N
(# obs)
22 Feb 2015 58.04 52.70 64.63 96
23 Feb 2015 61.37 59.32 64.17 96
24 Feb 2015 59.41 57.20 62.11 96
25 Feb 2015 56.55 54.93 59.32 96
26 Feb 2015 59.58 56.71 61.93 96
27 Feb 2015 53.89 51.96 56.55 96
28 Feb 2015 52.01 51.37 52.99 96
1 Mar 2015 54.24 50.68 59.29 96
2 Mar 2015 60.09 56.32 69.51 71
Mayo (Status: Active)
Period
Tsoilavg
−10cm (F)
Tsoilmin(avg)
−10cm (F)
Tsoilmax(avg)
−10cm (F)
N
(# obs)
22 Feb 2015 57.61 53.33 62.76 96
23 Feb 2015 60.34 58.30 63.18 96
24 Feb 2015 59.38 58.06 60.69 96
25 Feb 2015 58.05 56.53 60.53 96
26 Feb 2015 60.33 58.35 61.81 96
27 Feb 2015 56.33 54.82 58.24 96
28 Feb 2015 54.77 54.03 55.71 96
1 Mar 2015 56.71 53.58 61.11 96
2 Mar 2015 61.30 58.14 67.53 71
Monticello (Status: Active)
Period
Tsoilavg
−10cm (F)
Tsoilmin(avg)
−10cm (F)
Tsoilmax(avg)
−10cm (F)
N
(# obs)
22 Feb 2015 52.49 49.84 55.89 96
23 Feb 2015 55.99 54.39 58.39 96
24 Feb 2015 55.08 54.09 56.79 96
25 Feb 2015 53.78 52.92 55.51 96
26 Feb 2015 54.24 53.35 55.17 96
27 Feb 2015 52.51 51.12 53.94 96
28 Feb 2015 51.49 51.12 52.38 96
1 Mar 2015 52.13 50.63 54.41 96
2 Mar 2015 55.06 53.42 59.67 71
Back
Thanks for sharing that Joel.
Mace,
I was amiss (as usual) in not attaching the websites for FAWN (http://fawn.ifas.ufl.edu/) and My Florida Weather (http://fawn.ifas.ufl.edu/mffw/index.html) for your readers. The My Florida Farm Weather is farmer owned weather stations with FAWN connectivity. It appears we have 5 in Suwannee county. Initially, these sites, with all the tabs to click, may be hard to negotiate. If some one needs assistance I suggest they get with their local Extension agent to learn how to navigate through all the different potential data reports.
Joel
Thanks Joel. I can’t figure out how to get accumulated rainfall from MFW. Simple minds just want to know how much it rained last night. FAWN has a good system for accessing 24 hour, 3 day, and 7 day rainfall totals. Quickly.
Joel, I think you were actually “remiss.” LOL