Do you ever feel like you missed a week of your life? I’m beginning to wonder where time has gone as this corn crop is quickly wrapping up for the season in North Florida. There has been some chatter about Growing Degree Days (GDDs) well ahead of last year. I recently found the coolest tool yet on http://agroclimate.org under the Tools tab. As we gear up to begin chopping corn silage, there is some great data available that will help make decisions.
I spoke with the agronomists for Monsanto and Pioneer this week about the hybrids and their observations. According to their research, the hybrids we planted this year need about 2750 to 2850 GDDs from planting to black layer. That is good baseline data to use in analysis. Additionally, I always use some basic rules of thumb: It takes 20 days from dent to black layer; 7 days from dent to 1/3 milkline-7 more days to 2/3 milkline-and just for simplicity 7 more days to black layer; finally, we accumulate about 30 GDD per day at this time of year.
We traditionally time our silage harvest at 2/3 milkline +/- depending on so many factors that impact farming in the Southeast. So as I pulled up the maps at agroclimate.org I am looking for a couple key factors. 1) When will we hit 2800 GDDs? 2) What is 7 days ahead of that? And 3) How does that compare to last year assuming we started on time last year?
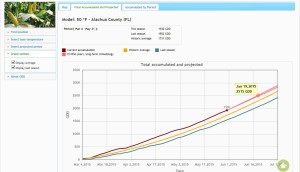
 Looking at the accumulated GDD chart, I begin to see that we are above the historic average and well above the 2014 average for corn planted on March 3, 2015. This chart shows clearly, we are “10 days ahead” of last year, or roughly 300 GDDs ahead. The GDD calculator tool also allows you to project GDD accumulation into the future. In this case I was looking for 2750 GDD minus 240 GDD (8 days * 30/day). For example, Pioneer 1319 is reported as 2730 GDDs from planting to black layer.
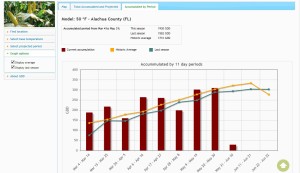
I have wondered when we “lost” the 10 days, and everyone tells me about a hot dry window of time on their farm. The agroclimate tool also has a great chart showing Accumulated GDDs per 11 day period. This can be compared to last year and the historic average. You can see on the chart, that large surpluses were accumulated in March and throughout April. I was a little surprised as I remember cool nights through much of that time, but days were also warm. If you have time, take a look at these tools on http://agroclimate.org and see how it shakes out for your location and planting dates.
